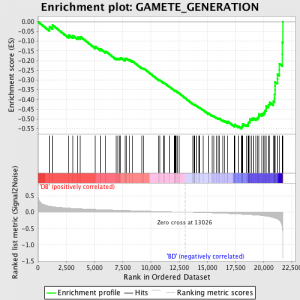
 Gene Set Enrichment Analysis is one of many approaches to the analysis of gene expression profile data and is described in a paper from workers at the Broad Institute.
The basic concept was prompted by the observation that studying individual genes showing the most significant difference in expression level between two states or phenotypes is lacking in mechanistic insight. Instead, it makes more sense to take a set of genes sharing some biological link, and ask the question – does the whole set show any statistically significant enrichment in those genes that have differential expression?
A gene set can be chosen, a priori, for a number of reasons e.g. the set of genes known to be influenced by over- or under-expression of a micro-RNA, or perhaps a set chosen based on chromosomal location, or genes for which molecular function, cellular component and / or biological process have been assigned using the controlled vocabularies of the Gene Ontology.
One advantage to the GSEA approach is that it is possible to incorporate your complete data set, not just those transcripts with an arbitrarily chosen differential expression threshold. I am sure that many people reading this will be thinking – “How can it be OK to use the complete dataset? Normally I would only consider genes with >2 (OR other favourite value)-fold differential expression.” The reason the approach is valid is that genes expressed at low levels or with large variance between replicates do not contribute to the main metric used by GSEA, the ‘enrichment score’ (ES).
GSEA works by first ranking the expression value for each gene by signal to noise ratio – calculating the difference between the mean values for samples representing each phenotype and scaling them by the sum of the standard deviations. This means that genes with large differences in expression level between different states and little variation between biological replicates are ranked highly.
The next step is that the ES, the primary statistic generated by GSEA, is calculated for each gene set – in the GSEA manual, which documents the software excellently, it states:
“All genes are first ranked by their signal to noise ratio, then the ES is calculated by “walking” down the ranked list of genes increasing a running-sum statistic when a gene is in the gene set and decreasing it when it is not. The magnitude of the increment depends on the correlation of the gene with a phenotype. The ES is the maximum deviation from zero encountered in walking the list. A positive ES indicates gene set enrichment at the top of the ranked list; a negative ES indicates gene set enrichment at the bottom of the ranked list.”
The ES values are normalised based on gene set size and then a false discovery rate is calculated, to give an estimated probability of false positives. GSEA uses a very relaxed default value of 25%, which is suitable for hypothesis generation with a relatively large number of biological replicates.
Scientists working on data from non-human samples can still use GSEA, but need to beware – the gene symbols used by GSEA are “translated” from their human equivalents i.e. identifiers used for genes from your species of interest represented on the microarray are converted into symbols for their human orthologues, then used in the analysis. Subramanian and colleagues claim that this conversion has little or no effect on the utility of GSEA; it has been used successfully in multiple non-human species, but of course this must be kept in mind when investigating results in detail.
For an excellent, in-depth, review of pathway tools, consult:
Another good source of advice on pathway analysis, especially for those familiar with the R statistics package is here.
Further reading

One Trackback
[...] data genome-wide for differentially-expressed transcripts. Using the Broad Institute’s marvellous GSEA tool, I assessed the statistical evidence that specific Gene Ontology terms and pathways were [...]