Five Reasons Why Academic Science Researchers Should Teach

I recently returned, albeit part-time, to work in academia and I was offered the chance to teach. Many academics in scientific research never teach, other than perhaps one-to-one “teaching” of a new doctoral student.  In the past, I have presented my work to other scientists and also given a few guest lectures to undergraduates; but this was the first occasion when the value and importance of teaching really hit me and I’ve tried to capture that below.  So, why do I think science researchers should teach?

Students ask great questions

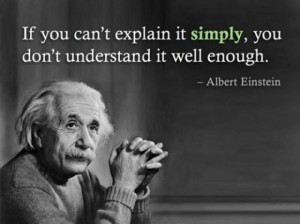
Let me write that again, because it’s so important: students ask GREAT questions.  ”Why is this done in this way?”, “How could I apply this approach in a different situation?”, “How could I explain this problem to another student?”. Their questions provoke thought & discussion with both students and your colleagues.  And they also prompt you to question yourself – how well do you know your subject?  Einstein is alleged to have said “If you can’t explain it simply, you don’t understand it well enough”.  Teaching is a marvellous way to improve your understanding of your own subject.

Teaching is an excellent way to recruit future masters and doctoral students

If your teaching is good, you will generate a pool of people who will know who you are and what you do – these people and anyone they tell about you, are a source of potential recruits to your lab.

Publicising your research

There are many ways to spread the word about your work, the most obvious and rewarded is conventional publication – preferably in a top-flight journal, of course.  Less obvious, however, is the value of publicity by word-of-mouth; despite the stereotypes, your students don’t just talk about sports, reality TV and drinking games; they will also tell people about your research.

Students benefit from being taught by practising researchers

Oh, yes, perhaps this should be number 1?  There will be a subtle difference between the approach and content of teaching from an active researcher and the non-researcher.  A tinge more enthusiasm, the latest methods, the newest discoveries – these are more likely from an active researcher.  They may not be the very best communicators, but some of that deficiency is made up for by being closer to the cutting edge.

Teaching helps your department

University administrators love it when their academics teach, because (whisper this) – it helps with the bottom line.

So, my advice to all those scientists out there, when they are asked if they’d be willing to do some teaching, is: Go for it!

Posted in Science Communication | 1 Response

Applications & Bottlenecks In Next Generation Sequencing, Day 2

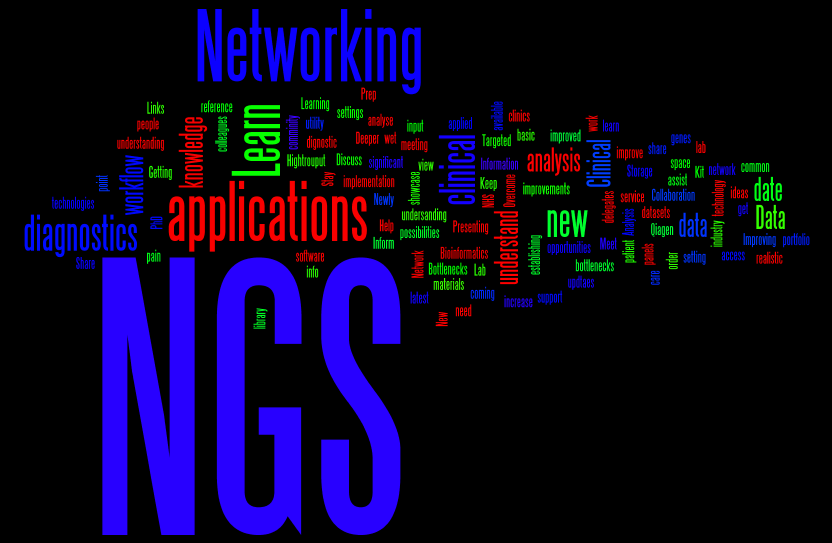
This word cloud shows the words that people used in the ice-breaking session, that I mentioned in my last post,  to describe what they hoped to gain from the conference.

On Day 2, our Keynote speaker was:

Amongst other things, Dr Seller, Director of Genetics Laboratories, Oxford, told us how whole families benefited from better definition of the pathogenic potential of variants found using NGS, removing, in some cases, the need to continue clinical follow-up.

The next presentation, by Magnus Rattray, Professor of Computational & Systems Biology, University of Manchester, was a departure from the main theme of clinical genome sequencing and was entitled:

“Inferring transcript expression levels from RNA-Seq data and scoring differential expression between replicated conditions”

Prof. Rattray described how his group have used statistical methods to compensate for the “noise” and possible biases in data from the NGS of cDNA, known as RNA-Seq, in order to identify genes  that are differentially expressed in various biological states.  A link to one of the tools used, bitseq, is in the Tweet below:

These techniques are not so far from the clinic e.g. in some cancers, RNA-seq is being used to provide a signature that may discriminate sub-types. Returning us squarely into the clinic, however, was our next speaker, Dr. Klaus Brusgaard, Associate Professor Clinical Genetics, Odense University & Director at Amplexa Genetics, whose title was:

“Comparison of NGS Platforms & Software”

Dr Brusgaard guided the audience through the whole clinical NGS process, from sample handling to final analysis.  Many of the illustrative examples used were from patients with epilepsy, especially childhood onset, where targeted sequencing of a gene panel was shown to be very powerful.

Our next speaker, Mick Watson, from ARK-Genomics at the University of Edinburgh, reminded us that humans are not only primates, but also hosts to a microbial community – our guts contain approximately ten times more bacteria than the number of eukaryotic cells in the rest of our bodies!

However, as you can tell from the shortened title in the Tweet above, Mick’s topic was the NGS and analysis of the combined genomes of the microbes (metagenome) found in the guts of ruminants.  He showed some compelling data that implied that we don’t need to see a reindeer to differentiate it from, say, a dairy cow, instead we could tell them apart by analysis of the metagenome sequences in their guts. Mick also briefly discussed the manifold influences of gut microbes on their hosts.

Les Mara, from Databiology, gave the next presentation, entitled:

“Avoiding the ‘Omics Tsunami”

- a cautionary tale about the importance of robust, scalable and easily deployed Bioinformatics solutions, in order to not only withstand the Big Data deluge, but to extract best value from your investment.

The last talk before lunch on Day 2 was given by Kim Brugger,  Head of Bioinformatics, EASIH, University of Cambridge, who had changed the title of his talk from:

to:

“Managing IT resources and NGS LIMS for free”

The emphasis of this talk was how free, open-source software could be assembled into a potent pipeline handling a variety of NGS data, tracking all updates, upgrades or other changes that would require re-validation and still confer confidence in results from one run to another.

The afternoon session was kicked off by Dr Jim White, NanoString Technologies, who took us beyond NGS, to a technology aimed at following-up on copy-number variants or differences in expression discovered in the research or clinical NGS lab:

TECHNOLOGY WORKSHOP – “NanoString hypothesis driven research tool drives NGS Discoveries towards the Clinic”

Using fluorescent probe hybridisation-capture, up to 800 different target RNA transcripts or genomic sequences can be quantified.

Our next speaker, Kevin Blighe, Lead Bioinformatician at the Sheffield Children’s NHS Foundation Trust, told us about:

He gave us a warts-and-all point of view of introducing NGS in a clinical environment, including the challenges of the perceptions of the UK National Health Service reported by the media…

The penultimate presentation of the day came from – me!  I gave the audience my point of view on the difficulties inherent in:

“Predicting Effects of Sequence Variants on Phenotype”

Inspired by a blog post, I gave an overview of the challenges and then attempted to answer some of these, emphasizing the importance of model organism studies to improve understanding of  genetic background effects, gene-environment interactions and non-coding variants.

Our last talk was given by:

Post-Doctoral Research Fellow in the School of Biomedical Sciences, University of Leeds.  Dr Ivorra-Martinez told us how a carefully constructed family pedigree and a good understanding of the inheritance pattern of schizophrenia, when combined with exome sequencing allows the identification of novel, likely causative, variants.


Based on the feedback that we received, the conference and workshops achieved many of our aims, in particular, stimulating conversations and offering opportunities for partnerships – perhaps we will see you next time?!
Posted in Genomics, Science Communication | 1 Response

Applications & Bottlenecks In Next Generation Sequencing

After months of preparation and the occasional sleepless night, November 5th arrived.  It wasn’t only Bonfire Night, but also the beginning of a two-day conference, focusing on NGS in clinical genetics laboratories.  Organised by my colleagues and friends from biotexcel and myself, it was held in the Manchester Conference Centre, in, naturally enough, Manchester, UK.

In order to break the ice, I had decided to deviate from the title of my opening presentation

and get the delegates to talk to their neighbours, explaining what they hoped to get out of the conference and writing this on a sheet of flip-chart paper, passing along each row.  This provoked a hubbub of conversation – which was what I wanted!  After this self-imposed interruption, I introduced the basics of genome-wide association studies (GWAS) and explained how NGS has been used in looking for causative variants and also to hunt for rare variants.

Giving the Keynote presentation on the first day was Prof. Tim Aitman, who told us about:

“Implementing NGS in research and the clinic”

He gave a tour-de-force, ranging from the analysis of NGS data from the genomes of disease model organisms through to the challenges of introducing targeted NGS as a clinical diagnostic tool.

Next up was Clark Mason, presenting on:

“Cell isolation by Flow Cytometry for Next Gen Sequencing and Sequence Detection”

This was a fascinating application talk, describing the power of cell sorting to facilitate sequencing from single-cell genomes.

Dr Jon Strefford told us about the unmet clinical need posed by chronic lymphocytic leukaemia (CLL) and how his lab is performing sequential NGS mutation analysis on single patients during therapy. Furthermore, he described how using NGS can improve prognosis for CLL.

Varsha Khodiyar gave the next talk, telling us about F1000Research, a journal using the Open Access model and how they are campaigning for better access to raw scientific data e.g. from NGS experiments.  Following up on this, as a kind of double-act, Ted Kalbfleisch told us about tools facilitating ways to visualise NGS datasets, that might be useful to peer reviewers and of course, to other scientists.

The lunch-break was a great opportunity to talk to other delegates, browse the exhibitors’ stands and peruse the posters. I got the impression that quite a lot of networking was going on in these breaks – a vital part of any conference.

Nick Downey, from Integrated DNA Technologies, spoke about:

”Enhanced solution based target enrichment using oligonucleotide probes and a novel composition of blocking oligonucleotides”

claiming that their enrichment probes for targeted NGS gave better results on GC-rich sequences than products from rival companies. We also heard about a Cancer gene panel for targeted sequencing of genes involved in acute myeloid leukaemia (AML).

Our next speaker discussed a critical area for clinical genetics:

Simon Patton guided us through the results of an extensive survey of the use of NGS in diagnostic genetics labs in the UK, giving a fascinating picture of  how rapidly the technology is being taken up.  He also emphasised the challenges of assessing the rates of concordance between labs using NGS on the same samples.

Conrad Lichtenstein spoke about technologies developed by Population Genetics:

“Making the most of Sequencing: Accurate targetted sequencing in pooled populations of 1000′s of DNA samples”

One of the approaches that  he described was essentially a very clever way to stick sequence “barcodes” onto long-range PCR products derived from multiple genomes, allowing a very high level of multiplexing.

Our next speaker, from Bio-Prodict,

described how protein structures from non-human species nevertheless can be useful in predicting the effect of human sequence variants, when integrated with other data e.g. from the literature. Furthermore, he claimed that the 3DM platform outperformed well-known tools such as Sift and Polyphen.

The last speaker on day 1 was Kate Thomson, talking about:

“Developing NGS strategies for use in a diagnostic setting”

Dr Thomson returned us to the clinical lab, reminding us of the power of NGS for identifying novel variants, but also the regulatory and ethical challenges it presents.

In my next post, I’ll tell you about the speakers on day 2.

Posted in Genomics, Science Communication | Leave a comment

So, What Do Your Genes DO?

abnormal development of the heart in mutant mice

Genes are not passive.  They are the target of molecular “dimmer switches”; typically (but not always) specific proteins, which dial up or turn down their activity.  Most genes are translated into proteins, but discovering the true role of those proteins, in the life of a cell or a whole organism, is still one of the great challenges of modern biology.

The best ways that we can assign function to proteins are by seeing what happens when we either switch genes off completely, ramp up their activity to abnormal levels, or introduce random changes into proteins.  Furthermore, if you are really interested in the function of a gene, the best test is to change your gene in it’s natural “environment”, by which I mean a whole living animal or plant, rather than in an isolated cell in a laboratory test-tube.  This is because another characteristic of genes and proteins is that they rarely act in isolation – more often, they act in concert with other proteins forming pathways or networks.

In a previous post, I described how we had found out which genes had been lost in a mouse with part of one chromosome deleted. We wanted to do this because as chance would have it, some people have the misfortune to be born with some of the equivalent human genes also missing.  But which of those genes was relevant to the symptoms people exhibited? Did all the genes contribute to the disorders, or were some genes more important? Of course, the only way to find that out with confidence would be to find (or create!) people in which each gene in the region had been modified – ethically highly questionable and technically very difficult. So, in the absence of people, one of our most powerful tools is to study genetically modified mice, with alterations in single genes instead of deletions of the whole chromosome region.

Abnormal development is seen in human embryos in which specific genes are lost and our mutant mice mimicked many of the same traits; some showed altered brain and skull, others heart and kidney defects.  Abnormalities in some of the mice affected adult behaviour, such as altering activity or anxiety, even in those with only one copy of a gene modified. Unexpectedly, we found that several different genes, physically close together, each gave similar abnormalities when they carried mutations e.g. four altered heart development, two gave kidney defects and several altered behaviour.

The story our mice told us was that it is likely that in people with deletions of several genes, many of the abnormalities are probably ensemble effects arising from the loss of several genes with similar functions, rather than the influence of a single, critical, ”master” gene.

Posted in Disease Models, Genomics, Target discovery | Leave a comment

Some of our genes are missing…but which ones?

Image courtesy of renjith krishnan / FreeDigitalPhotos.netOne can think of genes in a number of ways:

  1. At the level of the DNA – simply as a linear sequence of nucleotides, in ONE fixed order, in the “normal” state, or
  2. Again as a DNA molecule, but remember that genes in organisms, rather than in pieces of DNA in a test-tube, are subject to variation in different individuals, or
  3. The third way is to metaphorically zoom out and think about genes from the point of view of the whole organism and variations in those genes giving rise to variations in phenotypes. Variations in phenotype are the stuff of Darwin, the raw material on which natural selection works.

I wrote previously about a small mouse (jargon name – Del(13)36H) that had lost some of it’s genes and that this loss was associated with a quite complicated phenotype, described in our paper and similar in some ways to people that had also lost a chunk of genes.

When we first studied this mouse, one of our stumbling blocks was that we knew about only a few of the genes that had been deleted – we were in the early stages of the genome sequencing revolution, when only bits of the mouse (and human) genomes had been sequenced and genes mapped out. This was important because we wanted to be able to cross-compare mouse and human phenotypes and in order to do this, we needed to know whether the genes lost in the mouse had equivalents in humans and vice-versa.

So, the challenge we faced was to find those missing genes.   There was an ongoing philosophical and technical argument about the best way to find genes by DNA sequencing, that can be divided into two camps – the Mappers and the Improvisers.  The Mappers took a Map First, Sequence Later approach and the Improvisers preferred to Sequence First, Map to Check Sequence Later.

We fell into the first camp – so our first job was to build a map across the region deleted in our small mouse. But how do you build a map of an “invisible” landscape?

Obviously, by asking what is present in normal mice and absent in our small mice – this was made more difficult because mice that had inherited deleted chromosomes from both parents did not survive much beyond implantation. We had to build maps using mice that either had one or two copies of the relevant genes rather than the simpler situation of two copies or none.  It may come as a surprise that it is more difficult to answer the question – do we have one or two rather than two or none?  Nevertheless, we built a map, and despite what I wrote above, we sequenced parts of the map as we went along, rather than wait until we had the complete contours of the landscape determined. So, we were mapping parts of the landscape and once we were confident of that part, sending it off for sequencing.  As soon as the DNA sequences were returned, the genes buried in the sequence were uncovered and slowly, a complete gene map was stitched together.  We routinely followed up automated gene “annotations” with manual inspection and error-checking, which we believed supplied a Gold Standard gene map.

So what did we find?

Well, it turned out that 236 genes were deleted in our small mouse, plus also 95 “pseudogenes” – genes with uncertain functions – either they are unimportant  to the living mouse but perhaps act as material for evolutionary selection or they may regulate other genes? Of the genes that we could recognise, one of the most noticeable things was that there were several clusters of genes which showed high levels of similarity to one another – they belonged to gene families.  When we compared these gene families to their human equivalents, the main surprise was that the size of the family could be very different. One family of three genes encoding proteins involved in switching other genes on and off (gene regulation) was almost identical in mouse and human – whereas another family, making proteins that interact with pheromones involved in mate choice, was five times larger in number in mice than in humans. Indeed, the human pheromone interaction genes appeared non-functional; they were “pseudogenes”.  Perhaps we should not be so surprised by this when we think about the differences in mating behaviour between mice and humans…

The overall theme that emerged is of polarisation – the deleted region contains genes that are very similar to human genes and others that may not have functional human equivalents.  But to truly make sense of the list of genes deleted in our small mouse and it’s relevance to  human phenotypes or pathology, we need to understand what those genes actually do?

And that is a story for another day.

Posted in Disease Models, Genomics | 1 Response

Genetics Society Spring Meeting: Genomics for Health and Society

The aim of of the meeting was to begin to answer the question:

“What will be the impact of large-scale sequencing of human populations in the 21st Century?”

Held at The Royal Society in London on 19th April 2013, the meeting brought together some distinguished figures from clinical genetics, population genomics, DNA fingerprinting and the legal implications of genomics. There is an excellent summary of the meeting on Storify, as a collection of Tweets from several authors assembled by DJ de Koning, but I have included some highlights in this post.

Speakers at the meeting were Kate Bushby and the people shown below:

First to present was Jim Lupski from Baylor College of Medicine, Houston, on “Personal Genomes”.

According to Jim, one of his claims to fame should be that he was the first person in the world to be both first author and the subject of study on a personal genome paper.  His whole genome was sequenced and analysed because he is part of a pedigree or “clan”  (as he called it) segregating a peripheral neuropathy called Charcot-Marie-Tooth disease.  Jim Lupski’s talk was a bit of a romp with paper, case study and human stories tumbling out so fast it sometimes seemed difficult for him to draw breath.  The last story was particularly compelling – a tale of fraternal twins, with a movement disorder, that had undergone numerous inconclusive medical investigations before whole genome sequencing enabled a clear diagnosis and improved therapy.

Sir John Burn entitled his talk “Power to the People”. One of his main themes was that we were heading towards a clinical genome sequence data “traffic jam”.  An example of this is the recently announced NHS plan to spend 100M pounds on sequencing about 100,000 patient genomes. Some of the other issues this project raises are discussed in an excellent blog post, here.  Sir John emphasised that, in order to extract maximum value from these date, it will be vital to share information on variants in a way that preserves patient confidentiality.  One way to encourage sharing these data is to use “microattribution“, where scientists who have annotated a sequence variant gain credit for their efforts.

Posted in Genomics, Science Communication | Leave a comment

Gene & Cell Therapy For the People

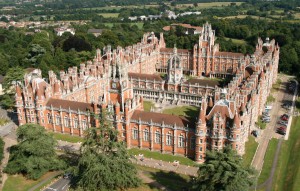
BSGCT Conference 2013 Venue - Royal HollowayThe Annual meeting of the British Society for Gene and Cell Therapy, as well as being aimed at the expert, included a day of presentations intended for students and the public.  Aimed primarily at GCSE and A-level students, but open to all,  this one day interactive event provided an opportunity to discuss and debate gene and cell therapy research with scientists, patients, journalists and clinicians, and to think about the impact that this research has on society.

The events of the day included talks by scientists working on gene therapy and stem cell research, followed by a question and answer session.  Students asked about career advice, current progress in gene and stem cell therapy research as well as the ethical issues raised.  For those reluctant to speak in public, the organisers encouraged people to ask questions using the Twitter hashtag #bsgctped or #bsgct

First speaker of the day was Dr Tassos Georgiadis:

Curing Blindness with Gene Therapy

Dr Georgiadis told us about different forms of inherited blindness and explained how gene therapy works in the eye. Some therapies halt a disease that would otherwise get progressively worse and others may actually improve sight.  The most awe-inspiring part of the whole talk was a short video ( you can watch it here – there is a 15 second advert first) showing how one person had his eyesight improved dramatically by gene therapy.

Next up was Dr Tristan (Tris) McKay:

What is Stem Cell Therapy?

Dr McKay explained that not all “stem cells” were equal; the different types, embryonic, fetal, and adult, have subtly differing potencies to develop into the specialised cells in the body. He also talked about a recent development that has contradicted a previously long-held dogma that specialised cells, such as skin cells, cannot become stem cells.  This breakthrough, allowing stem cells to be generated much more easily from adults, led to the discoverers, Sir John B. Gurdon & Shinya Yamanaka, being awarded the Nobel Prize for Physiology or Medicine in 2012. Anyone who would like to know more about Stem Cell Therapy could listen to the three lectures downloadable (for free) from iTunes U.

Stem Cell Therapy and Transplantation

Dr Emma Morris told us how she had asked her own children how best to talk about her work, on Stem Cell Therapy, with teenagers studying for their GCSEs or A-levels. Their answer was to do the same as she had done for primary-school children; the outcome was not patronising, but entertaining, enthusiastic and engaging.  Dr Morris studies, and uses in therapy, the stem cells found in the bone marrow that can specialise as blood cells. She told us about how bone marrow transplantation was first tried in 1959, to cure five Yugoslavian nuclear workers whose own marrow had been damaged by a nuclear accident. Unfortunately this failed because the workers’ immune systems rejected the transplants.  Since that time, as we have learned to control or avoid the problem of rejection, bone marrow transplantation has become a highly successful technique for treating cancers of the blood.  And not only can we use transplants from an adult donor, but also stem cells from the blood of umbilical cords or even our own blood stem cells – after “filtering” out the specialised cells.

Dr Morris also mentioned some of the more attention-grabbing experimental therapies such as building new tracheae with a plastic framework on which bone marrow stem cells can grow, given the right growth-stimulating factors, or “designer” stem cells programmed to attack cancer cells.  Some of these approaches remain highly speculative and in many cases have only been tested in mice, nevertheless, they are promising.

Have to mention that the audience was not composed entirely of students, but also a few general members of the public and during one of the breaks I:

The next presenter had a uniquely passionate point of view, because he was both a patient (with haemophilia) and a scientist; Dr Adam Jones:

Gene Therapy – A Patient’s Perspective

Dr Jones started by giving us a brief history of haemophilia – the earliest written record being in the Jewish sacred text, the Talmud, which dates back to between 200 and 500 AD.  He then launched into a semi-autobiographical series of stories – he was a good story-teller – about life as a haemophiliac, required to take a drug, called Factor IX, in order to avoid bleeding to death.  These stories were blackly comic and thought-provoking; particularly when he compared the cost of the NHS buying Factor IX for one person (£157,872 per year) with paying a Premier League footballer (~£250,000 per **week**)…

But what has this to do with gene therapy, you may be thinking?

Well, despite the existence of therapies for haemophilia, they are not a cure. Gene therapy is expensive, perhaps  ~£30,000 per treatment and indeed may not be a permanent cure, but may need to be repeated once or twice per year.  However, if such a therapy existed it would do two things:

  1. release haemophiliacs from the need for several injections of Factor IX per week into their veins.
  2. save money for the NHS.

Fortunately, research to achieve this goal is ongoing, with some early promising results.

The final speaker was Ed Yong, a science writer who left the lab after realising that it really didn’t suit him, because he enjoyed talking about science far more than doing it.
His topic was:

Beyond “The Gene for X”

Ed warned us that he was going to deviate from the main theme of the day and take us into the new territory of personal genome tests and the unfortunate tendency of the media to over-simplify genetics. He listed stories about genes that “cause” everything from our DIY skills, to risk-takingbeing politically liberal, or even eating a whole bag of crisps. Of course, none of these are simple, deterministic Mendelian genetic “effects”. But these subtleties rarely get reported, or if they do, they are buried well down the published text.  So, reader, beware.

In the area of personal genome tests, Ed related his experience with having his own genome tested by a company called 23andme – this threw up some strange results. Ed is of east-Asian origin and has black, ramrod-straight hair, but his genetic test results predict that he should have curly hair!

One of the most entertaining moments occurred when the PC temporarily froze and so Ed told the audience another story, about a girl called Lily with a mysterious disease for whom genome sequencing had offered hope for the future. This was a fascinating story of scientific discovery, yet tinged with an element of sadness because although the cause of Lily’s illness has been found, there is, as yet, no cure.

The final session consisted of the speakers and other scientists with expertise in stem cell and gene therapies, answering questions directly from the audience, or from tweets sent to #bsgctped during the day. There were some great questions e.g.

  • “How does the way stem cell research is done vary between countries?”  A: Significantly – regulations in UK are strict, but relaxed by comparison with the USA.
  • “What A-levels do I need to study medicine at University?” A: the only subject that is obligatory is Chemistry, but another speaker also mentioned that a slow route, but possible at some Medical schools, allows you to study any combination of A-levels, then study whatever first degree course your heart draws you to, then go into medicine later.
  • “How did the panel’s religious beliefs affect their science?” This drew a lot of very interesting replies…

This rounded up an entertaining and informative day and I would recommend it highly for science teachers or for GCSE / A-level students, especially if studying biology or for any member of the public, curious about this area of science, in future.

Posted in Science Communication | 1 Response

Moving Next-Generation Sequencing into the Clinic, part 2

In my last post, I summarised the first four talks from this symposium:

1st Oxford Workshop and Symposium, 4th Techgene Knowledge Network Meeting,
“NGS2013 Next generation Sequencing: Bioinformatics and Data Analysis”

You could also read the Tweets from the meeting here. But I digress. The afternoon session started impressively with Marcel Nelen, from Radboud University Medical Centre, Nijmegen, Netherlands speaking about:

“Clinical utility of exome sequencing in heterogeneous diseases.”

Dr Nelen described how a strong collaboration between research and diagnostics labs led to the application of exome sequencing in diagnosis of heterogeneous genetic diseases.  He emphasised the importance of a multidisciplinary team effort to define “packages” of genes for which there was evidence of involvement in either intellectual disability (ID), inherited blindness, inherited deafness, movement disorder or oxidative phosphorylation disorders.  The wide diversity of genetic variants that can cause such diseases means that Sanger sequencing, once the gold standard, has become too time consuming and expensive and gives a lower “diagnostic yield” than exome sequencing.

One critical aspect of applying high-throughput sequencing of exomes in a diagnostic setting is gaining appropriate informed consent from patients and their families.  Patients and/or their parents gave informed consent for the entire exome analysis. The sequence data from the exomes of ~550 patients entered a generic annotation pipeline and exome analysis was based on either a ‘de novo’ strategy for ID or a ‘in silico’ targeted strategy for the other diseases.

Analysis is based on a two stage approach:

  1.  Analysis of a “package” of genes defined as highly likely to carry pathogenic variants:
    • Search for variants in only these disease-related genes.
    • If pathogenic variant found, end analysis and report.
    • If no pathogenic variant found, move on to the second stage:
  2. Whole exome analysis:
    • If no pathogenic variant found, search for mutations in a specific  set of candidate genes.
    • If a pathogenic variant is found and there is solid proof for clinical interpretation, report.
    • Finally, if the earlier analyses fail, the remainder of the exome  is searched in collaboration with researchers and might be reported on if this “new” data holds.

One success story recounted by Dr Nelen concerned a specific case of intellectual disability, in which no causative variant had been identified over several years of investigation by Sanger sequencing of successive candidate genes, whereas whole exome analysis identified a pathogenic variant in the PACS1 gene.

In cases where “incidental” variants are identified, that appear to bear no relationship to the disease under investigation, these are passed to and assessed by an independent team of experts for advice, prior to reporting.

This tiered analysis has gained certification by the Dutch medical authorities as a genetic test and so might act as a model for other EU countries.

We heard next from Michael Mueller, from the NIHR Biomedical Research Centre, Imperial College London, UK, about:

“Rapid whole-genome sequencing: optimising the bioinformatics pipeline for faster turnaround times.”

Using whole-genome sequencing (WGS) for mutation detection can be more powerful than analysis restricted to just the exome. However, the data processing and handling challenges posed by moving WGS into the diagnostic lab are immense.  Dr Mueller described how different hardware and approaches to parallel processing of NGS data could be optimised, presenting some dramatic improvements.  By systematically identifying bottlenecks at each stage, he was able to reduce the time taken to produce  annotated variants, starting with raw Illumina short-read data from a ~ 30x coverage single genome, from ~24 to ~7 hours.  This appeared to be achieved without compromising read-mapping or variant calling quality.

In a follow-up to the talk from Marcel Nelen, Kornelia Neveling, also from  the Radboud University Medical Centre, Nijmegen, spoke about:

“Data analysis for diagnostic exome sequencing”

Dr Neveling began by describing the technical setup at the Radboud University Medical Centre, then sample handling and quality control and finally software tools to help in exome sequence variant filtering and analysis.   The diagnostics lab has access to three Life Technologies 5500 sequencers using the SOLiD platform and also two Ion Torrent PGM sequencers.

A critical step in sample and data handling is quality control (QC) to ensure that final clinical decisions are robust; some of the QC steps outlined by Dr Neveling were:

  1. Reliable identification of individuals and relationships (sibling / parent / unrelated)
  2. Accurate recording of metadata for each sample e.g. which software version was used for analysis? What was the date of analysis?, etc.
  3. That sequence data are highly specific and sensitive e.g. give sufficient, even coverage of all exons.
  4. Sequence variant calls meet biological expectations e.g. the ratio of transitions to transversions reflects natural variation.

The Radboud sequencing diagnostics team now have a database of about 1500 individual exomes and have found that a typical exome yields about 40,000 variants, with ~150-200 of those variants being “private” to each sample. Dr Neveling presented a variant filtering tool, with a graphical user interface that looked reminiscent of the software described earlier by Elliot Margulies and described briefly using the tool in a case of hereditary spastic paraplegia to aid in identifying the most likely etiologic variant.

Prof. Anthony J Brookes ended the Symposium, talking about:

“Assigning pathogenicity to NGS-derived variants”

Prof. Brookes was fizzing with ideas, provoking us to think about what we really mean by “pathogenic”.  Focusing on rare diseases, we were reminded that the concept of pathogenicity is a slippery, multi-faceted one.  Inferring pathogenicity can mean some combination of:

  • knowing allele frequencies in case and control populations
  • whether a variant has been described by others as pathogenic
  • whether a variant is absent from databases that are assumed (sometimes wrongly) to consist mainly of “normal” variants e.g. dbSNP
  • whether a variant co-segregates with disease in a pedigree
  • what the predicted (or known) effect of a variant is on protein structure
  • predictions in silico from tools such as PolyPhen or Sift
  • functional assays performed in living human cells
  • functional or phenotypic assays conducted in model organisms e.g. mouse mutants

Another level of subtlety in the way in which we define pathogenicity is that we can think of two contexts:

  1. has a variant ’caused’ a phenotype in a particular patient or family (which relates to expressivity)?
  2. can a variant ’cause’ a phenotype in a population (penetrance)?

Prof. Brookes argued that the clinical actionability of a variant should be thought of as a combination of pathogenicity, penetrance and expressivity. He went on to point out that too little is known about the relationship between genotype and phenotype and that we need a number of developments to bridge that gap and improve our ability to recognise pathogenic variants. In particular, he argued that a intermediary database system was required to link together primary resources such as dbSNP or Ensembl with clinical databases, to facilitate data-sharing without compromising confidentiality.  Combining this database  ’ecosystem’ with high data-quality electronic health records should improve our understanding of the genotype-phenotype relationship.


The symposium gave a good overview of the way in which NGS is being taken up in diagnostic genetic labs and used to improve the success rate in identifying causative variants.  In turn, this technological development should lead to better informed choice of therapies or treatments.  It will be intriguing to see how far we have progressed in a year’s time, when a followup meeting is planned.

If anyone would like to get in touch to discuss, correct or update my summaries, please post a comment, below, or send me a tweet:


Posted in Genomics | 1 Response

Moving Next-Generation Sequencing into the Clinic

On a glorious day (but with Arctic-like winds!) earlier this week, I attended a symposium on exploiting NGS in the diagnostic genetics clinic:

The speakers were clinicians, bioinformaticians and biomedical researchers; a good mix.  The organisers got things off to a smooth start and the keynote talk was given by:

Dr. Anneke Seller, Director of Genetics Laboratories, Oxford NHS trusts

“Transforming genetic testing in the NHS: the application of next generation sequencing to the diagnosis of Mendelian disorders”

Dr Seller guided us along a timeline of the development of genetic testing in the Oxford region NHS, noting that their main methods were focused on small panels of genes typed by either Sanger sequencing or one of the NGS platforms.  She explained how diagnosis of the variants causing hypertrophic cardiomyopathy (HCM) has moved from using denaturing HPLC onto high-resolution melting curve analysis and now to Haloplex PCR and the Illumina MiSeq platform.  Using NGS increased clinical sensitivity or “diagnostic yield” and when combined with control population data, improved classification of variants found in HCM, making it easier to define them as “unclassified” rather than as “likely pathogenic”.

The Oxford Clinical Genetics Labs validate variants using Sanger sequencing, but plan to stop this soon.  Looking ahead, their goal was to use sequencing of whole exomes to increase the success rate in finding causative variants.  Dr Seller emphasised the need to introduce better bioinformatics, rather than to struggle with data in Excel spreadsheets. Finally, she proposed that it was essential that the NHS transformed clinical genetic testing by the widespread introduction of NGS.

Elliott Margulies, from Illumina UK, spoke about:

“Whole Genome Sequencing and Analyses for the Clinic”

Dr Margulies introduced the Illumina sequencing platform briefly and then talked about some recent technical developments including:

  • the ability to use smaller size samples as sources of DNA, e.g. formalin-fixed paraffin wax embedded tissues
  • an open-source software alignment and variant calling tool, iSAAC
  • a modified file format for sequence variants, called gVCF.
  • a tool to facilitate easier filtering of a list of DNA sequence variants, tentatively called iAFT.

iSAAC is claimed to be able to align and call variants from a whole-genome sequence dataset in about 24 hrs, if it is run on a 12 core computer with 64 Gb RAM.

The variant filtering tool has a graphical user interface and is built upon open-source underpinnings e.g. the Ensembl VEP and uses data from various sources, including the Exome variant project and is provisionally called iAFT.  Using this tool reduces the scale of the problem of finding causative  variants, but when questioned by an audience member, Dr Margulies emphasised that, in the final analysis, the last decision is still the responsibility of the clinician.

Looking ahead, Elliott Margulies predicted a clinical “ecosystem” starting with taking a DNA sample at birth, much like the current heel-prick blood sampling, used for whole-genome sequencing, following up some individuals with exome sequences and linked with an electronic health record maintained throughout life.

The third speaker of the morning session was Matthew Addis, from Arkivum:

“Managing retention and access of genomics data”

We were presented with some salutary and entertaining tales of catastrophic data loss and then Matthew Addis explained the painstaking and rigorous approach that Arkivum take to ensure that their clients always have a backup copy.  Physical copies in multiple locations and regular checks on data integrity are key aspects to the system, including even a backup kept by a third party, in escrow.

In the last talk of the morning, Bas Vroling, from Bio-Prodict, spoke about:

“3DM: Data integration and next-generation variant effect predictions”

Using 3-dimensional protein models for every protein in a superfamily as their starting point, Bio-Prodict have built a tool that integrates multiple data sources in order to, or so they claim, infer the functional effect of sequence variants.  The delightful aspect of this approach is that 3-D models of proteins from non-humans can be used to infer the effect of variants in the human homolog.

One example that Dr Vroling gave was of a variant found in a protein involved in long-QT syndrome in horses could be used to predict the effect of variants in the equivalent human protein.  Using a large set of validated variants found in long-QT syndrome, the detection sensitivity of 3DM was 95% compared with ~65% achieved by another standard tool, PolyPhen.  The potential of the 3DM tool is clear, but whether it can be scaled up to cope with a complete set of all the proteins encoded in the human genome remains to be seen.

I’ve put summaries for the afternoon talks in another post.

Posted in Genomics | 1 Response

What might a small mouse teach us about human congenital abnormalities?

Mice are born with their eyes tightly shut, opening them for the first time only a few days later. So when a mouse was noticed that was smaller than normal and had been born with it’s eyes open, it drew attention. Abnormalities like this arise spontaneously in all animal facilities, but sometimes they are not one-offs, but inherited. It was not unexpected in this case, because the mother of this mouse was treated with X-rays to deliberately induce mutations, as part of a larger program of research aimed at producing animals that would be studied as models of human disease.

X-rays are the blunderbusses of genetic modification – almost no aim yet causing massive damage if they hit the target. Sometimes, they cause loss of whole chromosomes, or bits of chromosome are lost and the cellular DNA repair machinery sticks the pieces back together. In the rare cases where the damage is not lethal either to the germ cell or very early in development, congenital abnormalities are seen in some of the live-born.

It turned out that our small mouse had lost a chunk of one chromosome, resulting in many genes being present in only single copies, rather than the normal pairs.

There were two things we most wanted to know about our mouse – firstly, what other abnormalities did it have and secondly, how many (and which) genes had been deleted? These gaps in our knowledge were important because if we could fill them, it would help us to understand the pathological effects of the deletion and be in a better position to compare mouse and human. It turned out that our mouse had a constellation of symptoms – altered head shape, a mild tail kink together with eyes open at birth and smallness. Furthermore, some painstaking developmental studies showed that many mice with the partially deleted chromosome died between mid- and full-term of gestation.

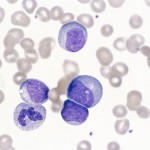
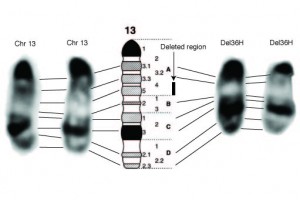
We first found this mouse back when whole genome sequencing was very expensive and financially impractical, so we relied on a combination of other, older methods to find out which genes had been lost. The simplest method uses a chemical stain that marks chromosomes with a characteristic pattern of bands, visible down the microscope (it’s shown in the picture at the top of this post), allowing an estimate of the percentage of the genome lost – this gave surprisingly close agreement with another method, based on genetic mapping, suggesting that 200-500 genes were lost (we later worked out exactly how many – but that’s another story).

Despite the obvious differences, at the level of the genes, mice are a lot like humans – by chance, many of the genes deleted in our mouse have also been deleted in some humans. Furthermore, people with these partially deleted chromosomes have one of a number of complex congenital disorders or syndromes, depending upon which specific genes are lost. These deletions are fortunately rare, but some of the associated disorders are common e.g. hearing loss or heart defects. Paradoxically, rare genetic events like this can teach us something about the other more common causes of these conditions.

Our small mice may be useful in studying why the genes lost in people cause these specific abnormalities and even lead us to new therapies.

The work we did on this mouse was carried out at MRC Harwell and is described in detail here.

Posted in Disease Models | 1 Response
  • Connect with us

    Link to ourLinkedin
    Link to ourRss
    Link to ourTwitter